CyberGIS for Spatiotemporal Problem-solving
The resolution of large-scale spatiotemporal problems is inherently associated with issues of data and computatinal intensity. The CyberGIS, which integrates capabilities of cyberginfrastructure and GIS, holds great promise for effectively solving these computational issues, especially with support from the combination of spatial thinking and computational thinking. Our exploration on cutting-edge CyberGIS mainly focus on the following directions:
- High Performance and Parallel Spatial Computing
- Big Spatial Data
- Large-scale Geovisulization
- Web GIS
1. High Performance and Parallel Spatial Computing:
* Agent-based modeling within a cyberinfrastructure environment: a service-oriented computing approach
CAGIS member: Dr. Wenwu Tang
Agent-based models allow for the bottom-up simulation of dynamics in complex adaptive spatial systems through the explicit representation of pattern-process interactions. This bottom-up simulation, however, has been identified as both data- and computing-intensive. While cyberinfrastructure provides such support for intensive computation, the appropriate management and use of cyberinfrastructure-enabled computing resources for agent-based models raise a challenging and intriguing issue.
To gain insight into this issue, we present a service-oriented simulation framework that supports spatially explicit agent-based modeling within a cyberinfrastructure environment. This framework is designed at three levels: inter-model, intra-simulation, and individual. Functionalities at these levels are encapsulated into services, each of which is an assembly of new or existing services. Services at the inter-model and intra-simulation levels are suitable for generic agent-based models; individual-level services are designed specifically for modeling intelligent agents. The service-oriented simulation framework enables the integration of domain-specific functionalities for agent-based models and allows access to high-performance and distributed computing resources to perform simulation tasks that are often computationally intensive.
We used a case study to investigate the utility of the framework in enabling agent-based modeling within a cyberinfrastructure environment. We conducted experiments using supercomputing resources on the TeraGrid – a key element of the U.S. cyberinfrastructure. It is indicated that the service-oriented framework facilitates the leverage of cyberinfrastructure-enabled resources for computationally intensive agent-based modeling.
Tang, W.
, Wang, S., Bennett, D.A., and Liu, Y. 2011. Agent-based modeling within a cyberinfrastructure environment: a service-oriented computing approach. International Journal of Geographic Information Science 25(9): 1323-1346.
2. Big Spatial Data:
* Parallel Map Projection of Vector-based Big Spatial Data: Coupling Cloud Computing with Graphics Processing Units
CAGIS members: Dr. Wenwu Tang, Wenpeng Feng
The objective of this study is to present a cloud-based parallel computing framework for accelerating the map projection of vector-based big spatial data. The past few years have witnessed substantial advances in cyberinfrastructure and data acquisition technologies, leading to tremendous growth of a wide variety of high-volume spatial data—i.e., big spatial data. Map projection is often needed when we apply these big spatial data into large-scale spatial analysis and modeling approaches that require a common coordinate system. However, due to the volume of these data and algorithmic complexity of map projections, the transformation of big spatial data between alternative projections represents a pressing computational challenge. Recent advancement in cloud computing and high-performance computing offers a means of addressing this computation challenge. The parallel computing framework in this study is based on a layered architecture that couples capabilities of cloud computing and high-performance computing accelerated by Graphics Processing Units as well as Internet GIS. We used large LiDAR data as an example of vector-based big spatial data to investigate the utility of the parallel map projection framework. As revealed by experimental results, the framework provides substantial acceleration for the map projection vector-based big spatial data. Further, coupling cyberinfrastructure-enabled high-performance and cloud computing, which complement to each other, is a suggested solution for the efficient processing and analysis of big spatial data.
3. Large-Scale Geovisulization:
* Parallel construction of large circular cartograms using graphics processing units
CAGIS members: Dr. Wenwu Tang
Cartograms are a cartographic approach that is based on the geometric transformation of enumeration units to enhance spatial presentation of variables of interest. The automatic construction of cartograms within digital computing environments, as recognized in the literature, is impeded by the issue of computational efficiency. Parallel computing is a potential solution for tackling the computational issue of cartogram construction, and its importance is increasingly acknowledged with the wider spread and application of advanced cyberinfrastructure into geographic studies. The purpose of this study is to investigate the use of a state-of-the-art parallel computing approach, graphics processing units (GPUs), to accelerate the construction of large circular cartograms, a special form of area cartograms. GPUs, built on many-core computing architecture and thread parallelism, provide tremendous high-performance computing and even supercomputing support for general-purpose geocomputation. In this study, the construction of a circular cartogram is divided into a large number of fine-grained subtasks that can be efficiently and simultaneously computed on the underlying many-core GPUs. Simulated and real data were used in experiments to examine the computational performance of GPU-enabled construction of circular cartograms. Experimental results suggest that the GPU-enabled parallel computing approach offers significant acceleration performance for the construction of large circular cartograms, and thus sheds further light on the resolution of computationally intensive spatial and spatiotemporal problems using advanced cartographic and geovisualization approaches.
Tang, W., in press, Parallel construction of large circular cartograms using Graphics Processing Units, International Journal of Geographical Information Science.
4. Web GIS:
*An Advanced Web GIS Portal of Santee Experimental Forest
Online at: http://cybergis.charlotte.edu/santee/
CAGIS members: Dr. Wenwu Tang, Wenpeng Feng
The USDA Forest Service Santee Experimental Forest was established in 1937 as a 2,468-ha site for silvicultural research involving hydrology, soils, and vegetation. There are three following spatial datasets:
- Hydrology: the SEF contains four gauged watersheds which provide data on stream flow and water quality for streams draining two 1st, one 2nd, and one 3rd order watersheds. Water table data from a network of shallow ground water wells within these watersheds is also available.
- Climate: the SEF has climatic records dating to 1946. Presently complete climatic data are available from three full weather stations. In addition, rainfall and temperature data are available for a number of field stations within the forest. atmospheric deposition and ozone data are also available.
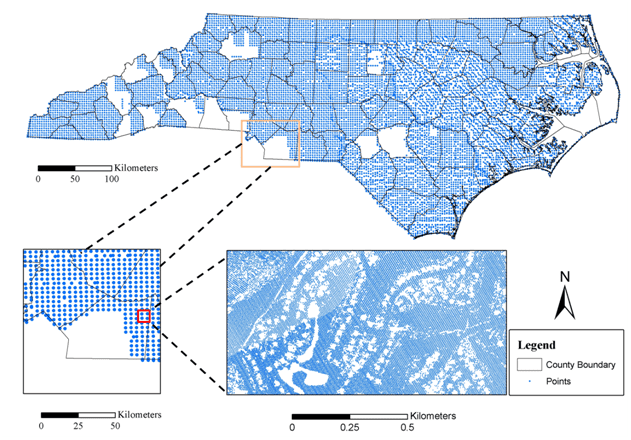
- Land resource data: the GIS-based data on topography, hydrograph, vegetation, soils, as well as aerial photography and satellite images are available to view and download. Other spatial data available include: LIDAR data for the SEF in 2006, historic land use and ownership plats, and digital elevation model (DEM) data.
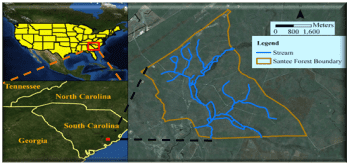
Figure 1. Santee Experimental Forest
The key functionalities consists of two components:
4.1. User-customized spatial temporal data query:
- Spatial data description and metadata;
- Web mapping for stations and the boundaries of each watershed and SEF;
- Query of time series data;
- Report and plot of query results
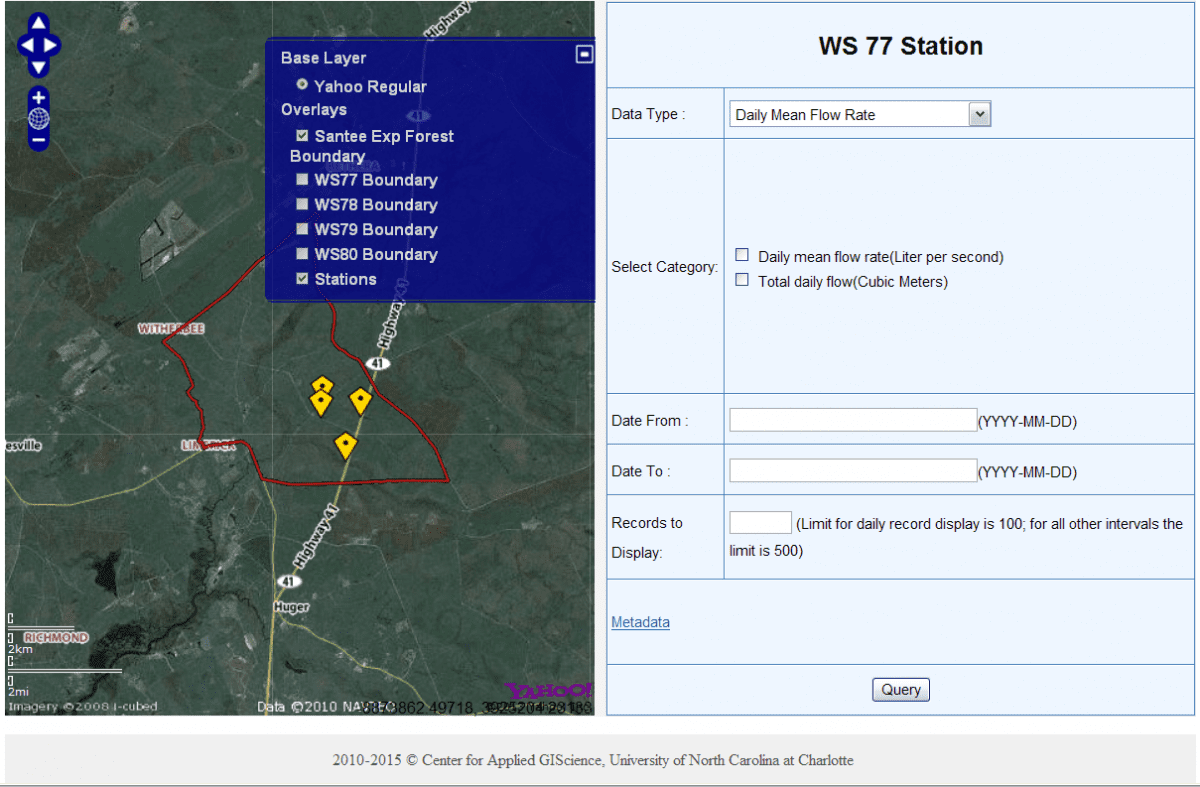
Figure 2. Query Page of GIS Datasets
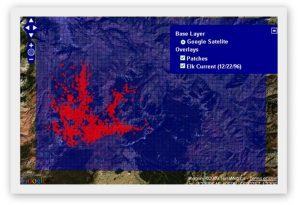
4.2. GIS layers visualization and download
- Organization and visualization of GIS and LIDAR datasets in a web-based manner;
- Web mapping (Currently support GIS datasets);
- Download datasets (for GIS and LIDAR data)
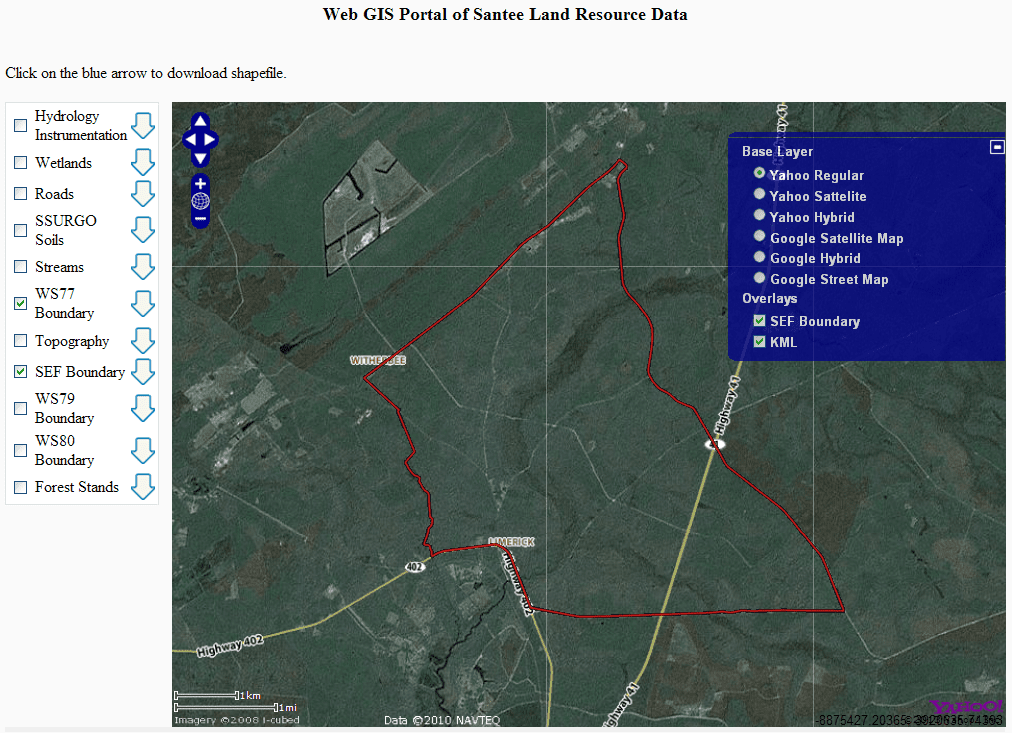
Figure 3. Web GIS portal of Santee Experimental Forest